Beyond Promises and Projections: How True Testing Surpasses Branded Estimates in Product Effectiveness

Beyond Promises and Projections: How True Testing Surpasses Branded Estimates in Product Effectiveness
Key Takeaways
- Manufacturer benchmarks cherry-pick results to make new products look better.
- In-house benchmarks can unfairly handicap older hardware for newer models.
- Standardization bodies allow misleading guidelines, leading to inflated product performance claims.
If you’re shopping for a new piece of computer hardware, be it a GPU, CPU, monitor, wireless router, or case fan, you should avoid manufacturer claims and instead read and watch professional benchmarks and reviews, user reviews, and ask your tech-savvy friends for advice. Here’s why.
Manufacturer Benchmarks Are Often Rife With Cherry-Picked Results
If you’ve ever seen manufacturer benchmarks, you’ve noticed that they always include a selected number of game titles or app benchmarks and that the games and apps change depending on the manufacturer. In other words, there isn’t a standardized benchmark suite that hardware manufacturers use to test their new products.
Instead, each manufacturer cherry-picks the games and apps in which their new products achieve the best scores compared to the competition. This is a standard practice whether we’re talking about CPU and GPU makers such as Intel, NVIDIA, or AMD, or smartphone brands. Some phone makers such as Samsung, OnePlus, and others went too far and were even caught cheating in some benchmarks . Motherboard vendors, memory makers, or any other manufacturer making hardware that can be benchmarked are just as likely to cherry-pick only the benchmarks that cast their products in the best light, and who can blame them?
Better still, the games and apps that appear in manufacturers’ presentations change with each new generation, since a new CPU or GPU might be better in some games than its predecessor, but also because a new product might run a new and shiny AAA game everyone’s talking about better than the competition.

AMD
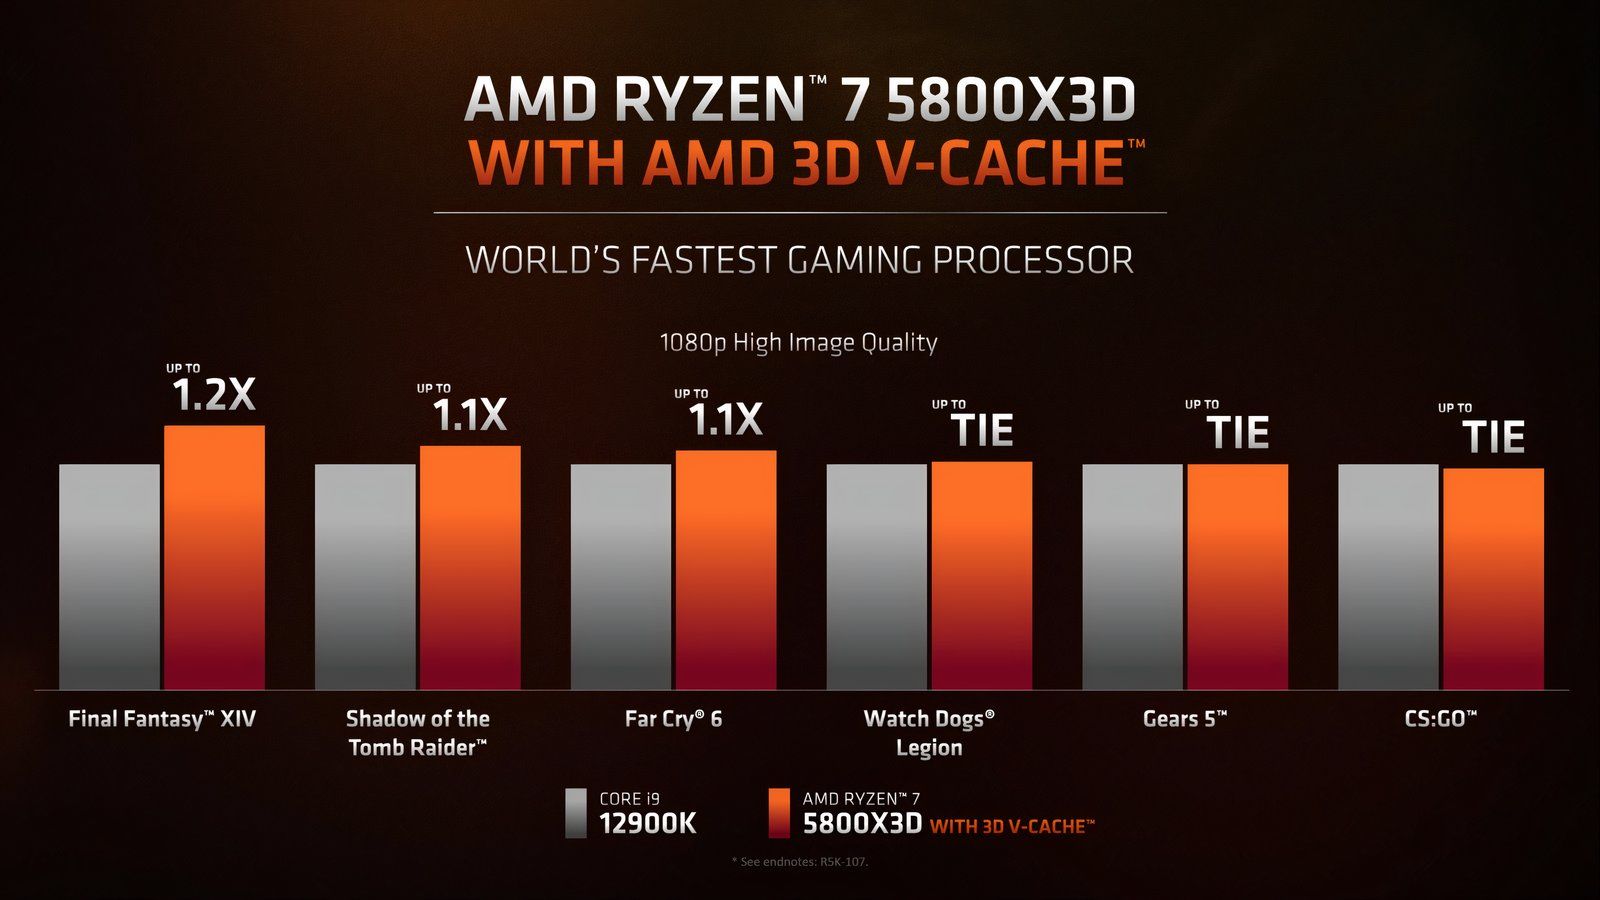
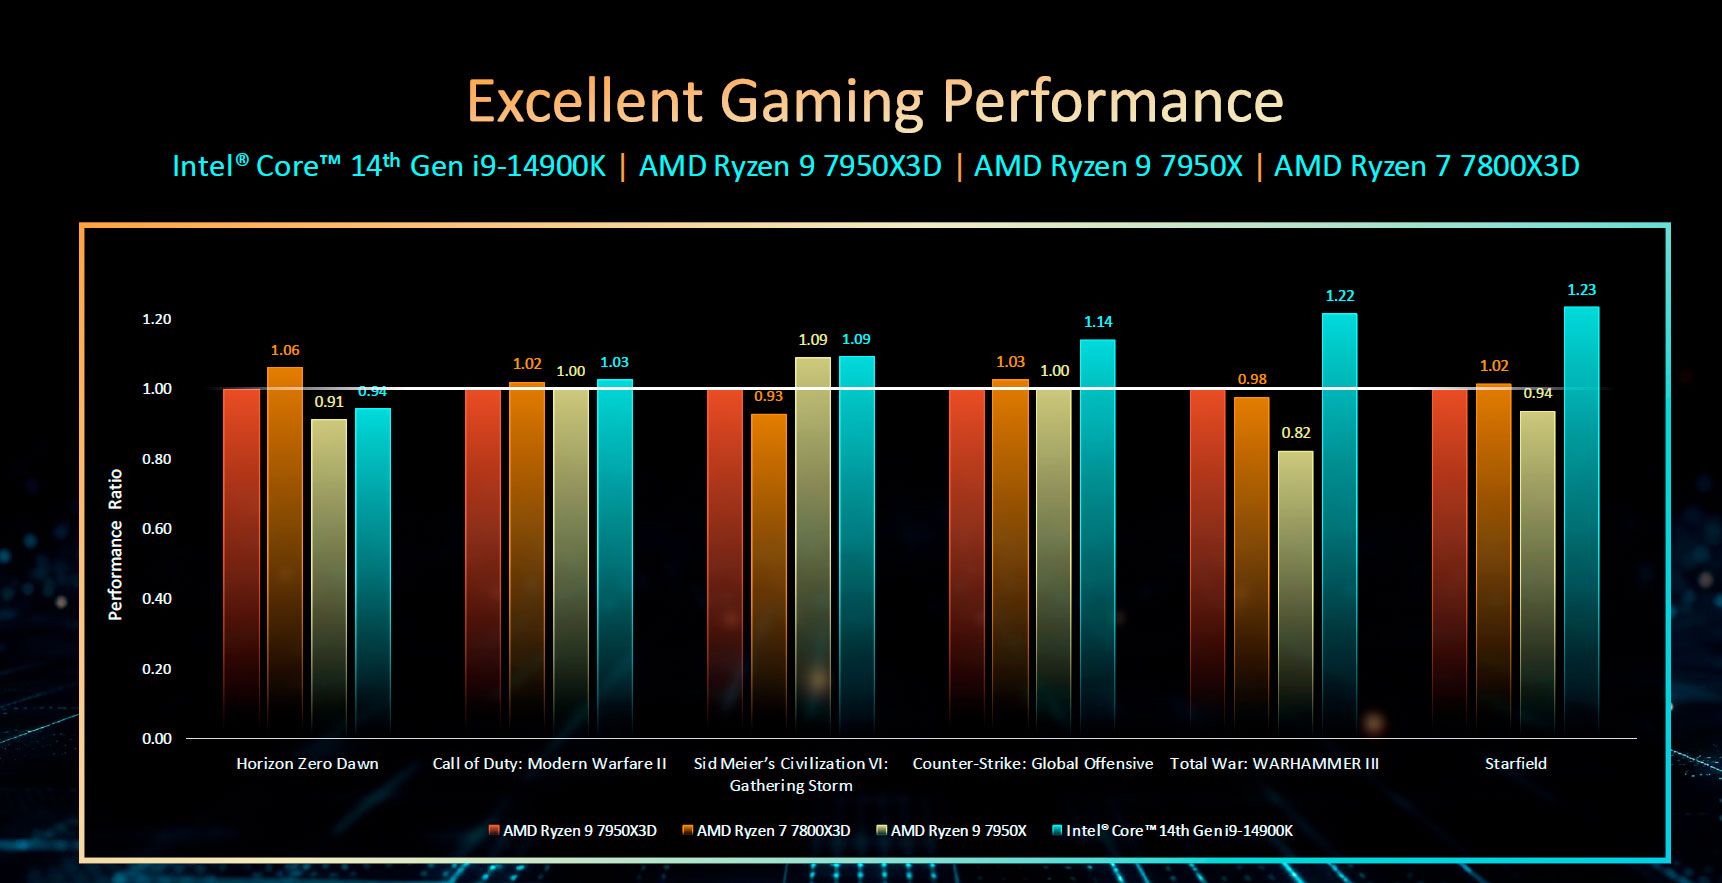
Let’s take AMD and Intel CPUs as an example. The AMD Ryzen 5800X3D came out on April 20th, 2022, and the AMD Ryzen 7600X on September 27th of the same year. That’s a five-month gap between the two CPUs, but they were listing completely different games in their gaming performance slides. The 5800X3D is shown above this paragraph, with the 7600X performance slides shown below.

AMD
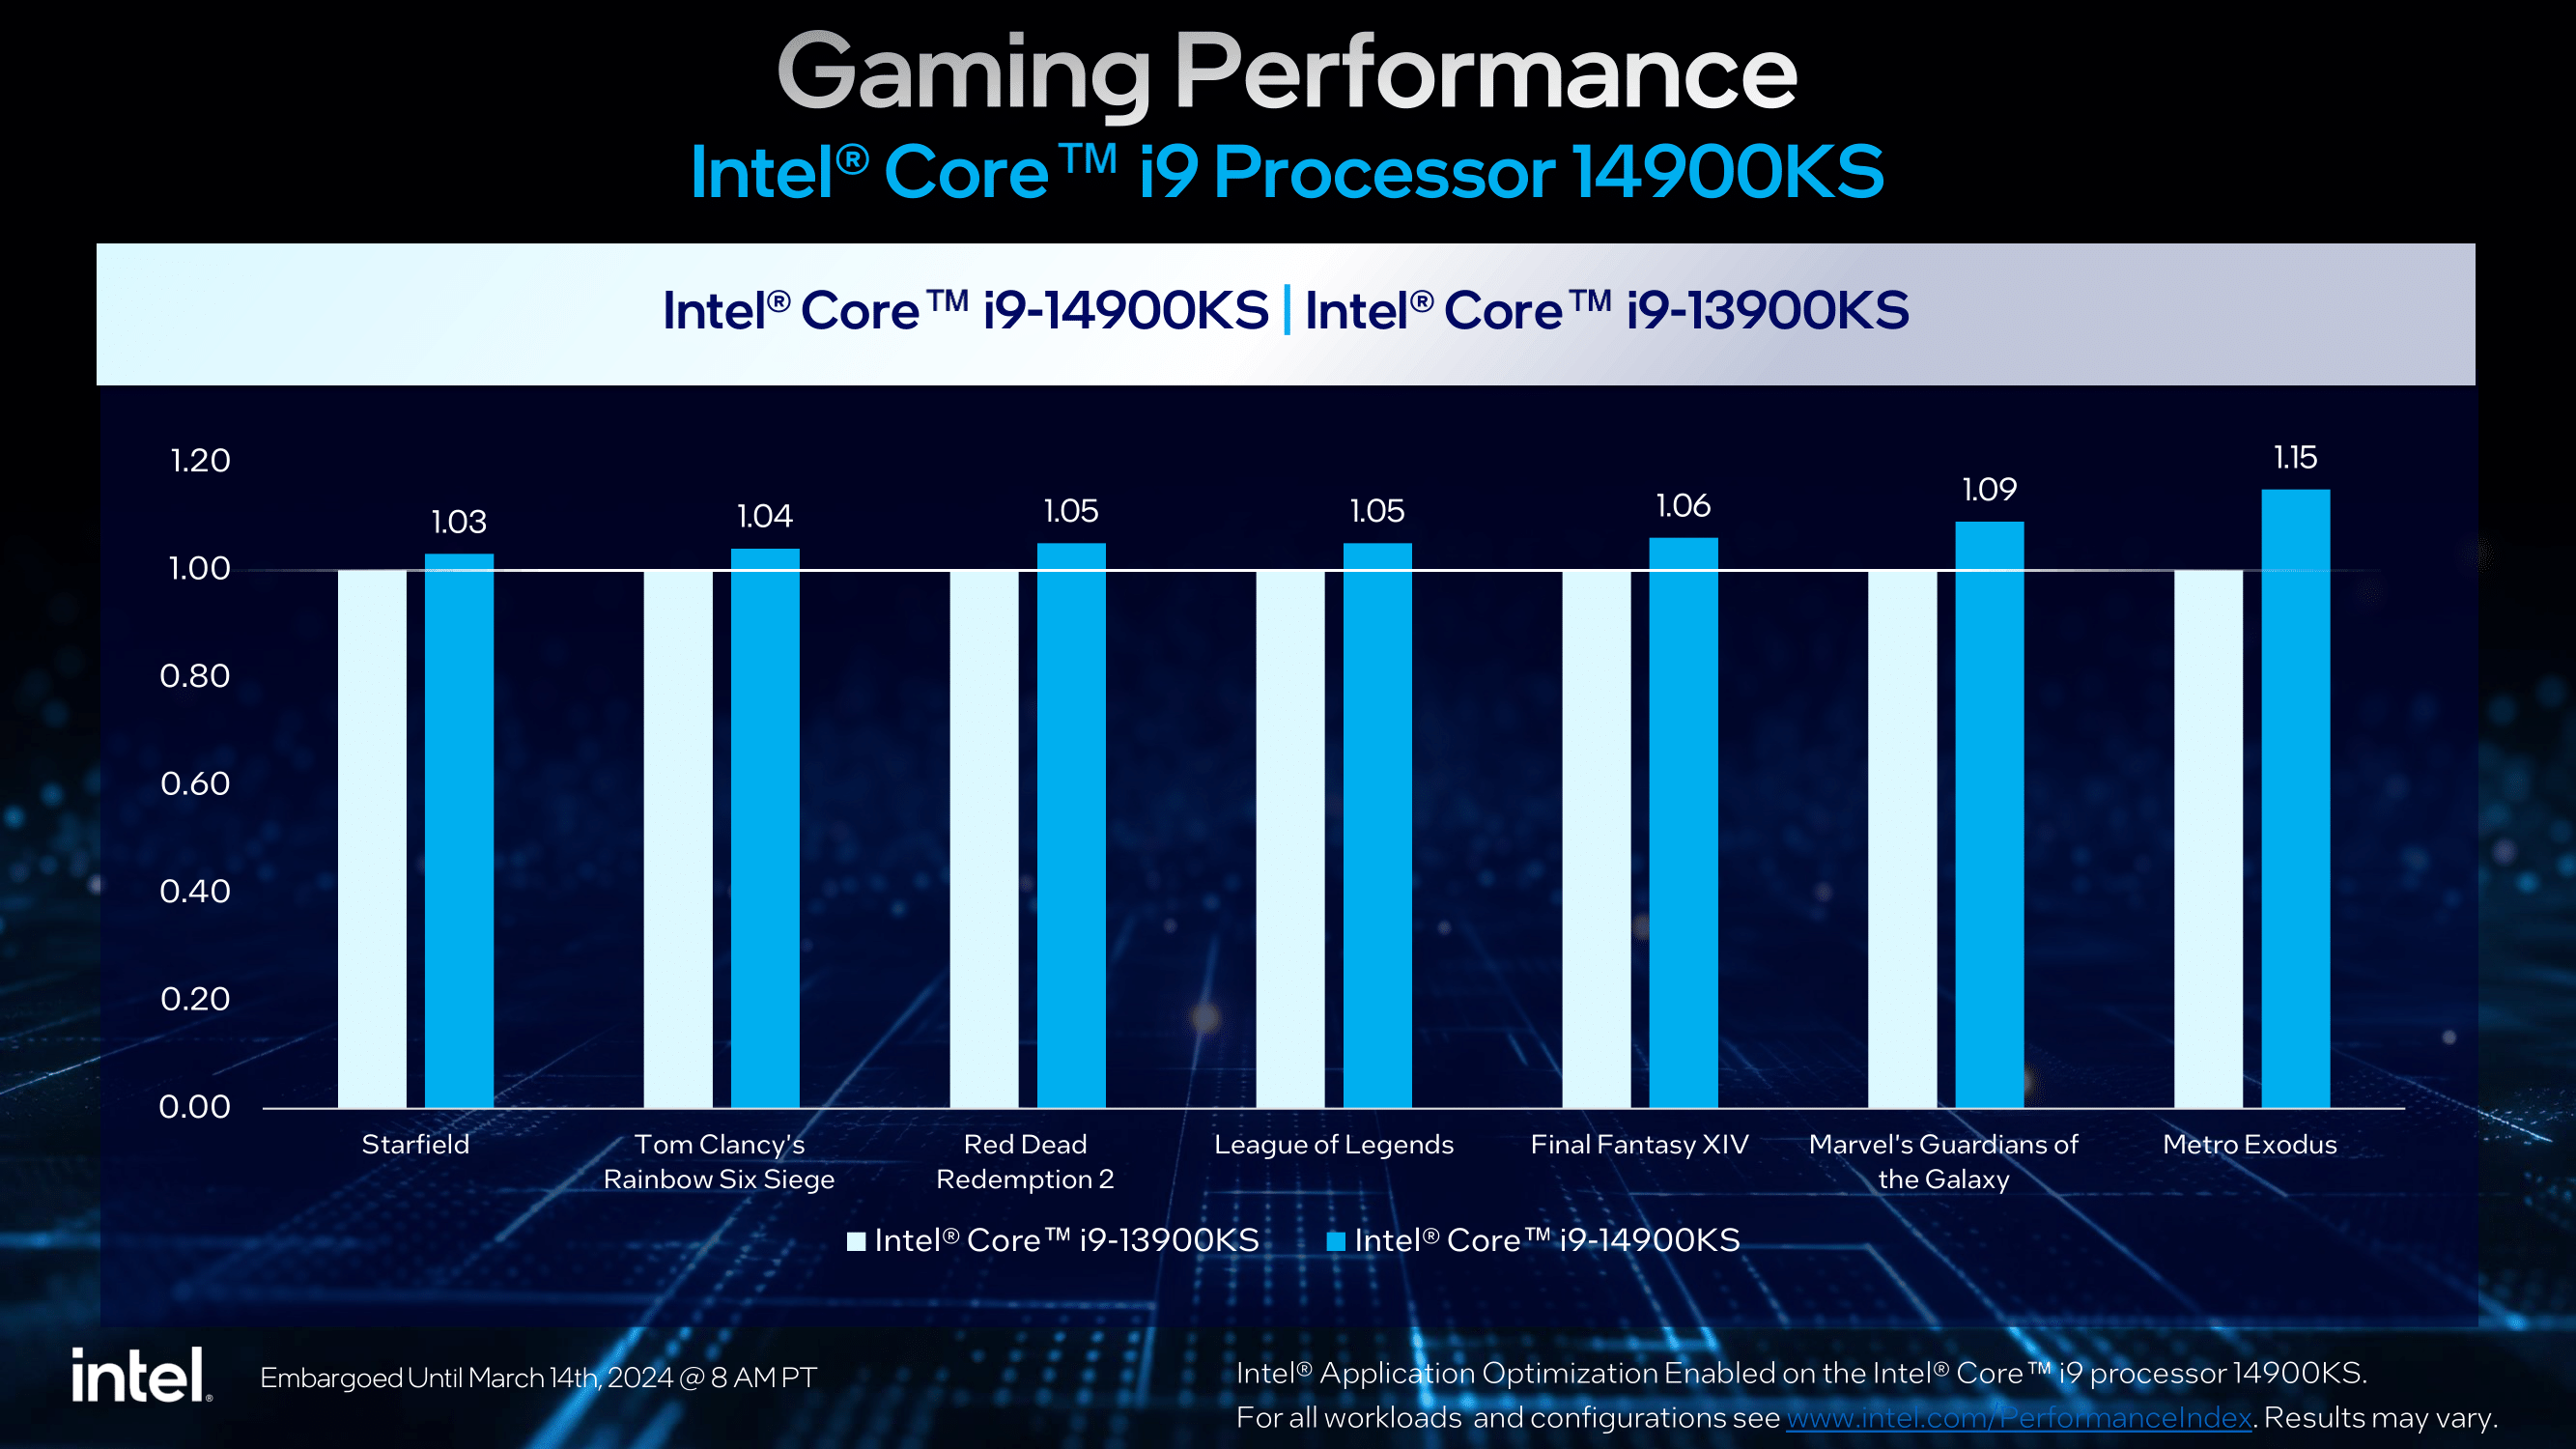
Next, we’ve got two Intel CPUs, the Core i9-14900K and the Core i9-14900KS.

Intel
The release date gap between the two CPUs was about five months. This time, the two products only share one game, Starfield.

Intel
On the other hand, the best professional reviewers out there keep a suite of games and apps with which they test the products, and they rarely change them. This way, you can compare how various products perform across the same game and app suite. In the case of thermal testing, for instance, most professional reviewers use the same test systems packing the same CPU with the exact same power settings if they’re testing CPU coolers, or use the same CPU and GPU combo when testing PC cases.
That said, no single test suite is perfect, and due to the nature of hardware testing, each test suite will inadvertently favor one brand over the other. For example, let’s say that NVIDIA GPUs, in general, perform better in Unreal Engine games than AMD GPUs. Since many popular games use the Unreal Engine, NVIDIA GPUs would most likely fare better compared to their AMD counterparts than they actually do in a test suite dominated by Unreal Engine games.
This is why you shouldn’t read or watch just one source of reviews. Instead, you should gather information from various reviewers to get the best overall picture of how the product you want to purchase actually performs.
In Some First-Party Benchmarks, Old Hardware Is Unfairly Handicapped
Cherry-picked results are just the tip of the iceberg regarding manufacturers’ ways of making their new and shiny products look better than the competition or their older products.
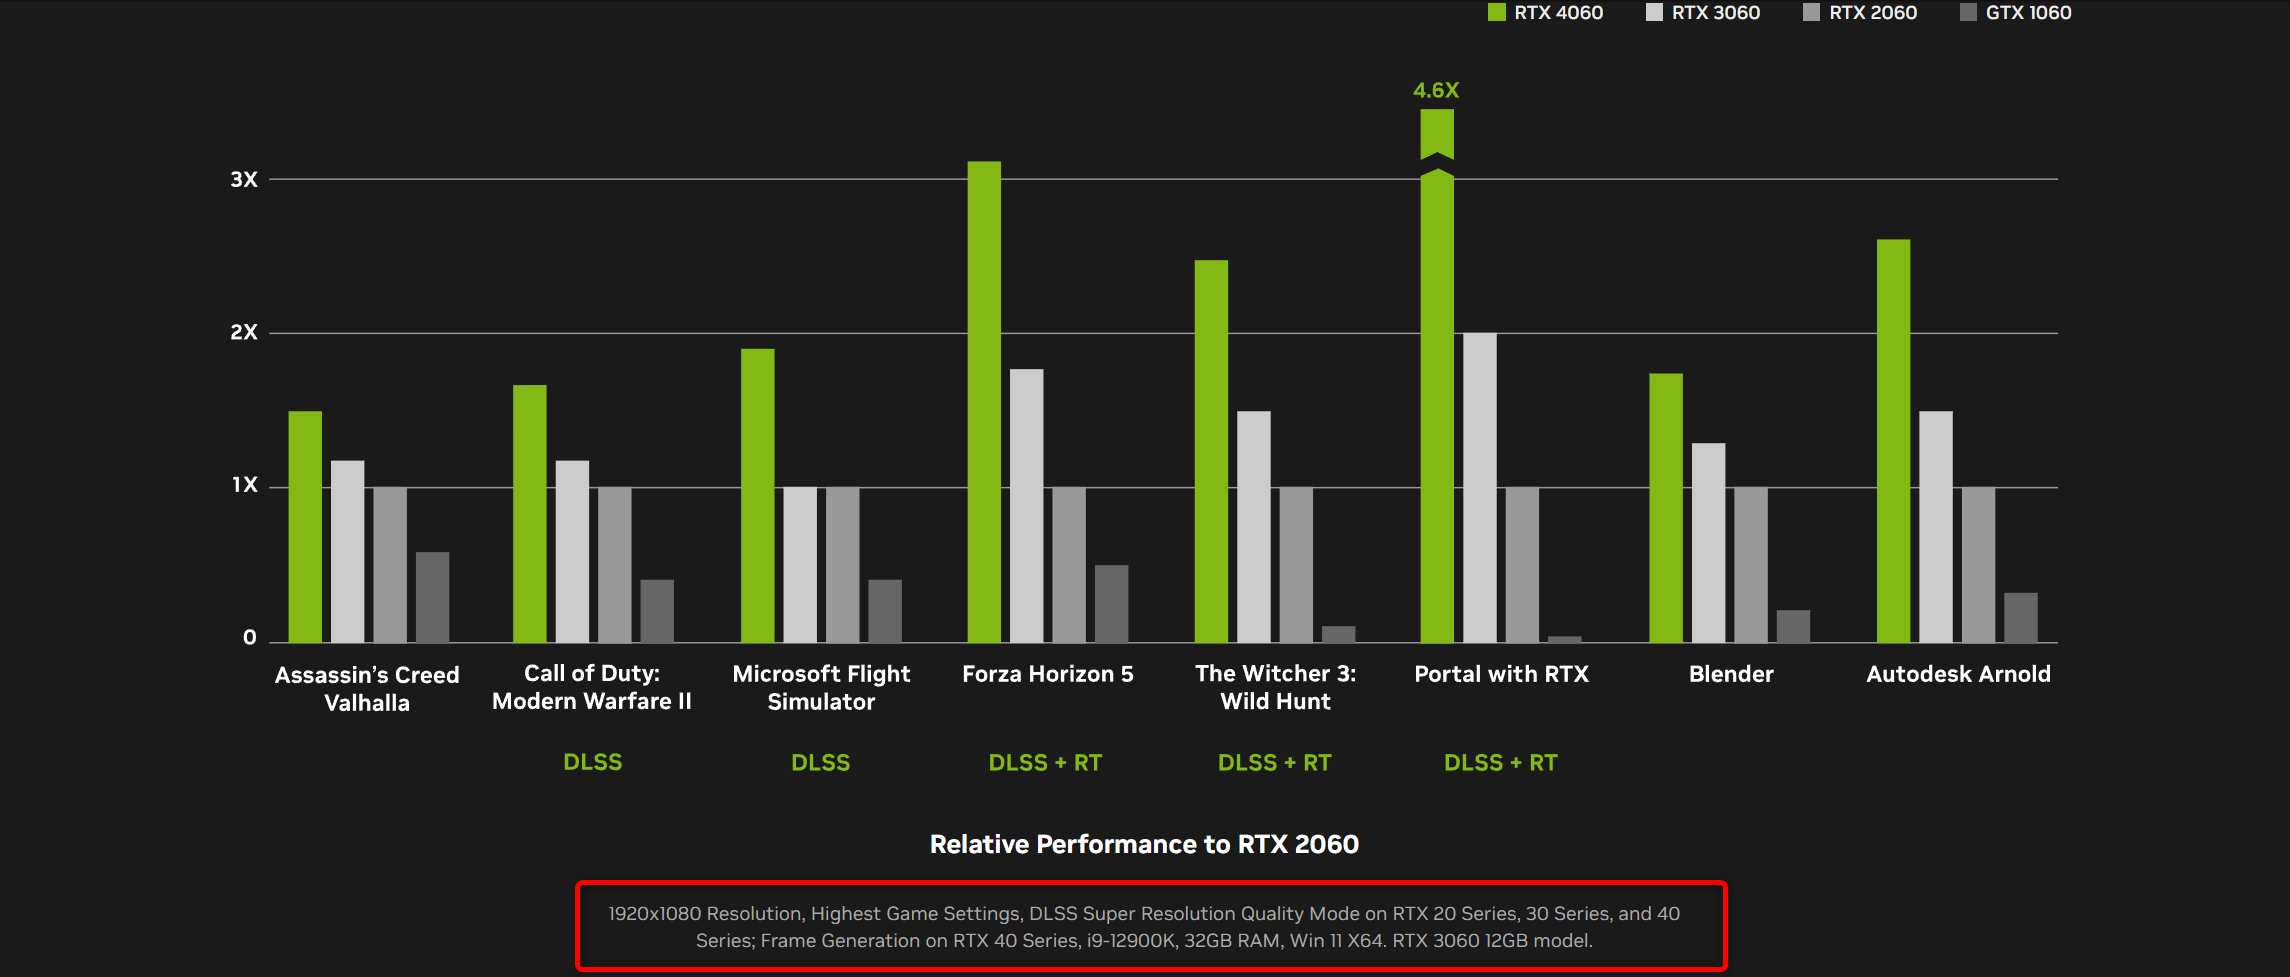
For example, when presenting the RTX 4000 GPU series, NVIDIA, naturally, compared their new GPUs with previous generations of its graphics cards. The issue here is that in NVIDIA’s gaming benchmarks, RTX 4000 cards were using DLSS frame generation , a feature not available on RTX 3000 and older GPUs. This resulted in seriously overblown performance numbers of RTX 4000 GPUs compared to the real-world results.
Just look at the RTX 4060 page on NVIDIA’s website and check those performance comparisons vs. the RTX 3060 and RTX 2060. According to NVIDIA, the RTX 4060 is around twice as fast as its predecessor and almost three times faster than the RTX 2060. But the catch here is that the RTX 4060 uses frame generation, a feature unsupported by RTX 3000 GPUs, leading to grossly overstated gaming performance. This is a perfect example of a manufacturer unfairly handicapping its older products.

NVIDIA
If you jump to TechPowerUp’s RTX 3060 specs page , you can see that the RTX 4060 is only 18% faster than the RTX 3060. The incongruity in the measured gaming performance between the two sources stems from the fact that TechPowerUp tests GPUs with a standardized test suite, using the same exact settings for every GPU, and not using features older GPUs do not support, such as DLSS or DLSS frame generation. This also isn’t perfect because, in all honesty, the RTX 4060 is faster than 18% on average than the RTX 3060 when you turn on ray tracing, but TechPowerUp’s way of testing GPUs is much more fair to the RTX 3060 compared to what NVIDIA did.
Some Manufacturer Claims Have Little to Do with Reality
PC monitor manufacturers are known for greatly exaggerating the performance of their products. The most egregious example is response time, with monitor vendors using the absolute best result a monitor achieves in response time measurements as the official spec instead of using an average response time across a number of different measurements, which would better reflect real-time performance.
Many modern gaming monitors feature an official response time spec of 1ms, but their real-world performance is far less impressive. Unless we’re talking about OLED monitors, no monitor can achieve an average response time of 1ms. Even one of the fastest non-OLED gaming monitors on the market, the Asus ROG Swift Pro PG248QP, which features a 540Hz refresh rate, has an average gray-to-gray response time performance of 2.31ms, as seen in TechSpot’s review of said monitor.
Then we have wireless routers that often tout max bandwidth that’s far removed from reality and only achievable under controlled laboratory conditions. These numbers usually apply to the total bandwidth they’re capable of delivering to multiple clients simultaneously and not the performance you can expect when using a single client device.
Let’s take the RT-AX88U Pro, one of the best Wi-Fi routers on the market, as an example. If you visit the router’s web page , you can see that the maximum bandwidth over the 5GHz band is listed as “up to 4804 Mbps.” However, a real-world review by Dong Knows Tech has measured only 1510Mbps, with a few other routers surpassing the RT-AX88U Pro. Don’t get me wrong; this is an impressive result, but it is far from ASUS’s claims.
Some Blame Is Reserved for Standardization Bodies and Their Lenient Guidelines
While manufacturers often boast about the unrealistic performance of their devices, sometimes standardization bodies and their lenient (one might even say misleading) guidelines are to blame instead.
A few years ago, VESA, the authority on computer display standards, released its VESA DisplayHDR 400 standard. The only two requirements were a max brightness of 400 nits and the ability to accept HDR10 signals. The issue is that DisplayHDR 400 didn’t require local dimming and 10-bit color gamut support, two features required for a good HDR experience.
You can’t have true HDR without local dimming because proper HDR video includes increased luminosity of bright areas of the image but also the ability to make dimmer areas of the picture darker in contrast to the brighter areas, which cannot be achieved with regular, edge-lit backlights.
Another requirement for a solid HDR experience is 10-bit color support that covers about 75% of the visible color spectrum because HDR signals include a much wider color range than SDR signals. VESA had only asked manufacturers to equip their monitors with an 8-bit color range, which covers only about 36% of the visible spectrum, to get the HDR 400 certification.
This led to a flood of HDR 400 PC monitors with a subpar HDR experience. VESA released an updated version of the standard sometime after, but even the revised standard doesn’t have local dimming as one of the requirements.
Then we’ve got the mess that is HDMI 2.1 . Back when HDMI.org , the HDMI certification body, released the HDMI 2.1 standard, many thought that the 48Gbps bandwidth needed to support high refresh rates on 4K displays was a requirement. It turned out it actually wasn’t , which resulted in a flood ofpoor quality “HDMI 2.1” cables that didn’t support the 4K@120Hz video signal.
As you can see, hardware manufacturers constantly try to spin their products’ official specifications and performance claims to make them look better than they really are. Your best bet is to just ignore manufacturers’ claims and do the research yourself by watching or reading professional reviews. When reading user reviews, my advice is to skip 5-star reviews and instead focus on 4 and 3-star user reviews.If there are any with the right knowledge and experience, take advice from friends and family who are in the know concerning tech and hardware.
Also read:
- [New] In 2024, Quick & Comfortable Game Capture Tips for Rainbow Six Siege
- [Updated] Select Selections Exciting Cardboard-Friendly Virtual Reality Titles
- Apple Updates Its Product Line-Up, Declares 9 Mac Models Outdated - Implications for Users and Retailers Explained | Gadget Digest
- Discover the Ultimate Selection: ZDNet's Best Gaming Mechanical Keyboards of 2023
- Freelancers’ Corner Yearly Best FREE Text Files for 2024
- In 2024, Exploring the Peaks of MAGIX Samplitude A Comprehensive Review
- M3 MacBook Pro Unveiled – Comprehensive Guide on Release Schedule, Pricing Insights, Detailed Features Overview, and Additional Resources
- Maximizing Efficiency with an HP Copilot+ Laptop: My Expert Review on Boosting Telecommuting Performance | Insights
- Navigating Android to Windows Shared Drives
- Resolved: Fixing PC Instability in 'The Witcher 3' On Windows
- Review: The 'Smallest Webcam on Earth' - A Compact Powerhouse of Versatility, Uncovered by Tech Guru at ZDNET
- Tablet Meets Notebook: A Detailed Look at iPad Pro vs MacBook Air for Optimal User Experience | ZDNet
- Top Four Social Media Giants: Exploring Facebook, Twitter, Instagram & YouTube
- Top Rated 2023 Dual-Function Device Unlocks Hidden Office Perks: A Comprehensive Review
- Top Rated Tablets : Comprehensive Analysis & Reviews by Tech Experts
- Ultimate Guide to Top-Tier Electronic Notekeepers: In-Depth Analysis by Industry Experts - PCMag
- Title: Beyond Promises and Projections: How True Testing Surpasses Branded Estimates in Product Effectiveness
- Author: George
- Created at : 2024-12-20 19:08:32
- Updated at : 2024-12-27 21:35:58
- Link: https://hardware-tips.techidaily.com/beyond-promises-and-projections-how-true-testing-surpasses-branded-estimates-in-product-effectiveness/
- License: This work is licensed under CC BY-NC-SA 4.0.