Decoding GPU Performance Metrics: A Comprehensive Guide

Decoding GPU Performance Metrics: A Comprehensive Guide
Quick Links
- Synthetic vs. Real-World Benchmarks
- Productivity Benchmarks
- Resolution
- Average FPS, 1% Low, and Frame Time
- Clock Speed
- Ray Tracing
- Upscaling
- Temperature, Acoustics, and Power Draw
Key Takeaways
- Prioritize real-world over synthetic GPU benchmarks, as they have more relevant data.
- Productivity benchmarks are similar to synthetic but also account for software optimizations, so results can vary.
- For gaming performance, pay close attention to the average FPS, but don’t forget about the 1% and 0.1% lows.
Benchmarks are a staple of PC building. They provide easy-to-understand figures that help you decide which PC part offers the best performance, regardless of the specs. Perhaps no benchmark is as prominent as the all-important GPU benchmark.
Synthetic vs. Real-World Benchmarks
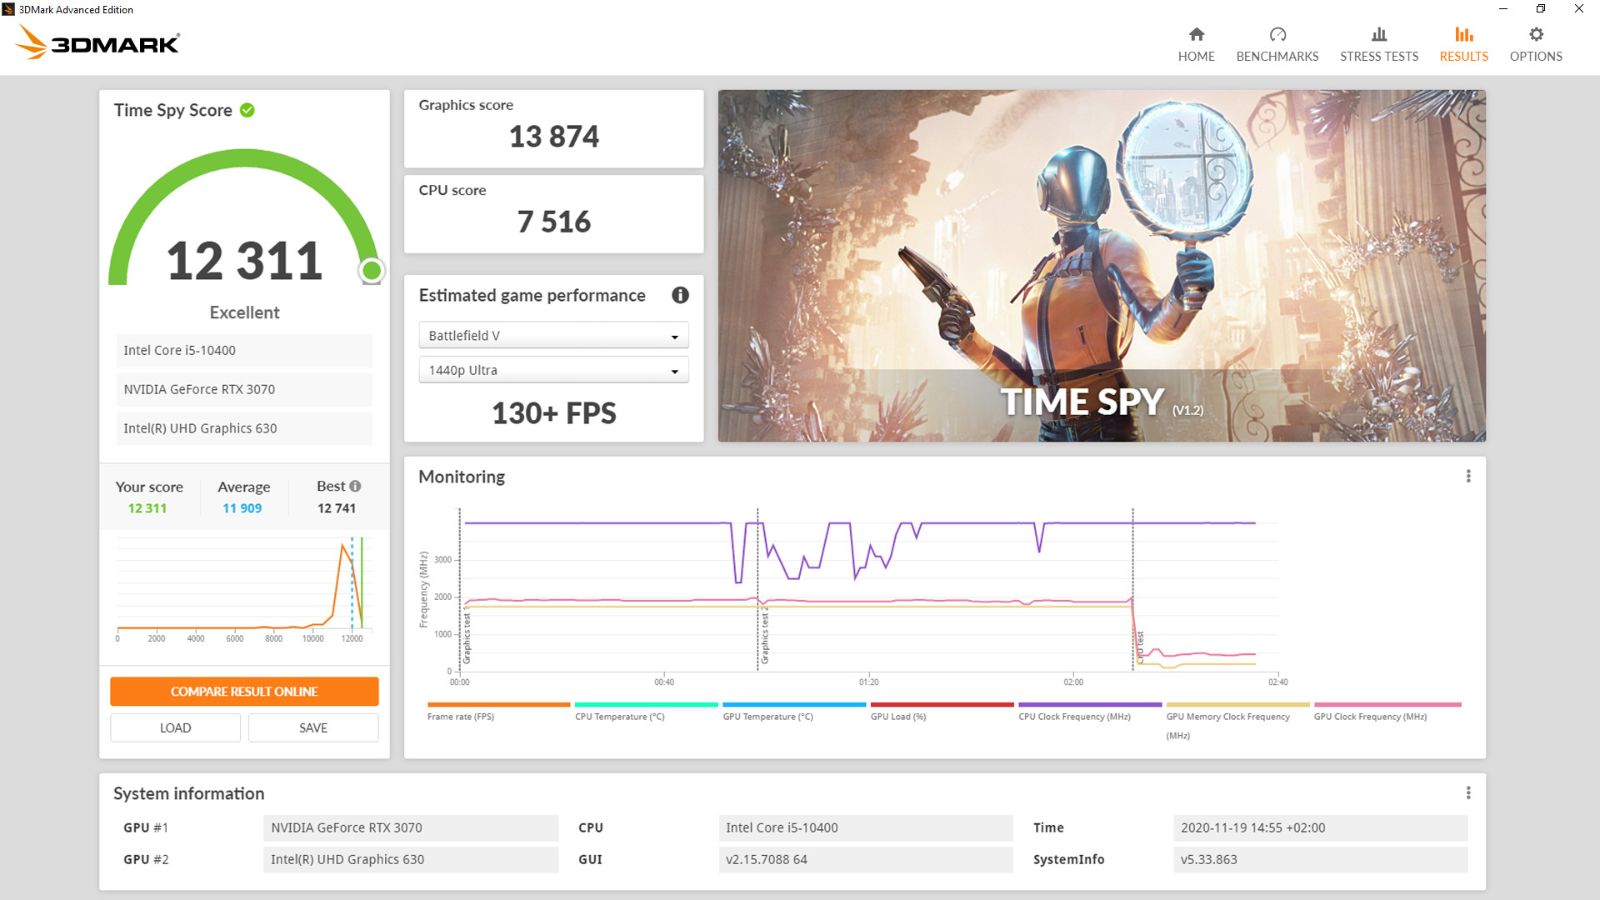
There are two main types of GPU benchmarks: synthetic and real-world benchmarks. Synthetic benchmarks are artificial tests that test a GPU’s raw performance in a standardized test. The most popular GPU benchmark tools are 3DMark , Blender , and UNIGINE Superposition . In contrast, real-world benchmarks rely on GPU performance in apps that people use. These usually come in the form of in-game and productivity benchmarks.

I believe synthetic benchmarks are generally more relevant for GPUs than for CPUs, even if they have flaws and can’t account for optimization and various GPU technologies. Synthetic benchmarks push the GPU to render complex workloads, which is the GPU’s primary function. In contrast, CPUs can have very different performance results depending on how well an app utilizes its threads .
Still, I recommend prioritizing real-world benchmarks. They are both more relevant and closer to what you’ll use the GPU for, so you’ll have a better idea of what to expect.
Productivity Benchmarks
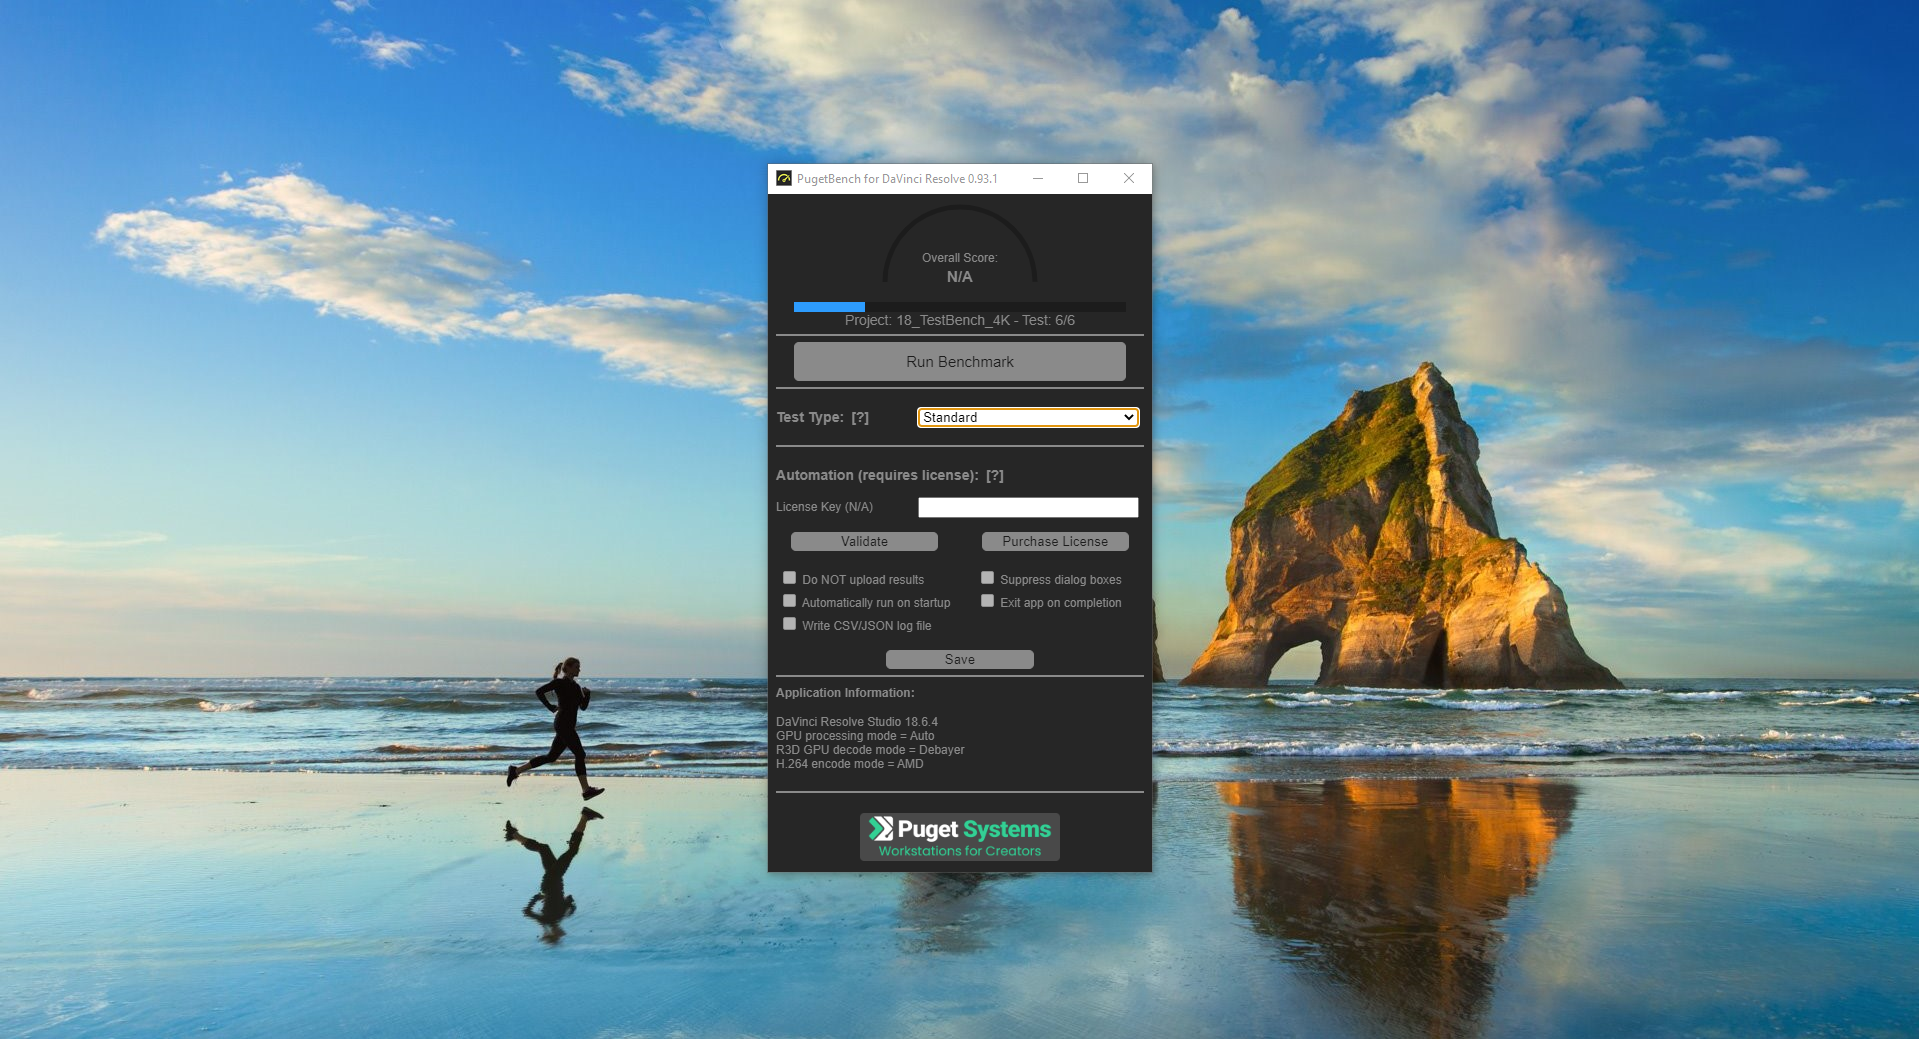
Productivity tools that heavily rely on GPU rendering are also an excellent way to test raw performance, but software optimization plays a big role here. For instance, NVIDIA has invested heavily in the CUDA platform, and since most productivity programs are designed around it , NVIDIA GPUs often outperform those from AMD and Intel. It’s especially obvious in tasks centered around AI and machine learning.
Still, the other two companies are catching up fast. Price is still a factor, and you might be able to upgrade to a higher-tier GPU to get even better performance. So, prioritize benchmark results in the tools that you use.

PugetBench for DaVinci Resolve
Resolution
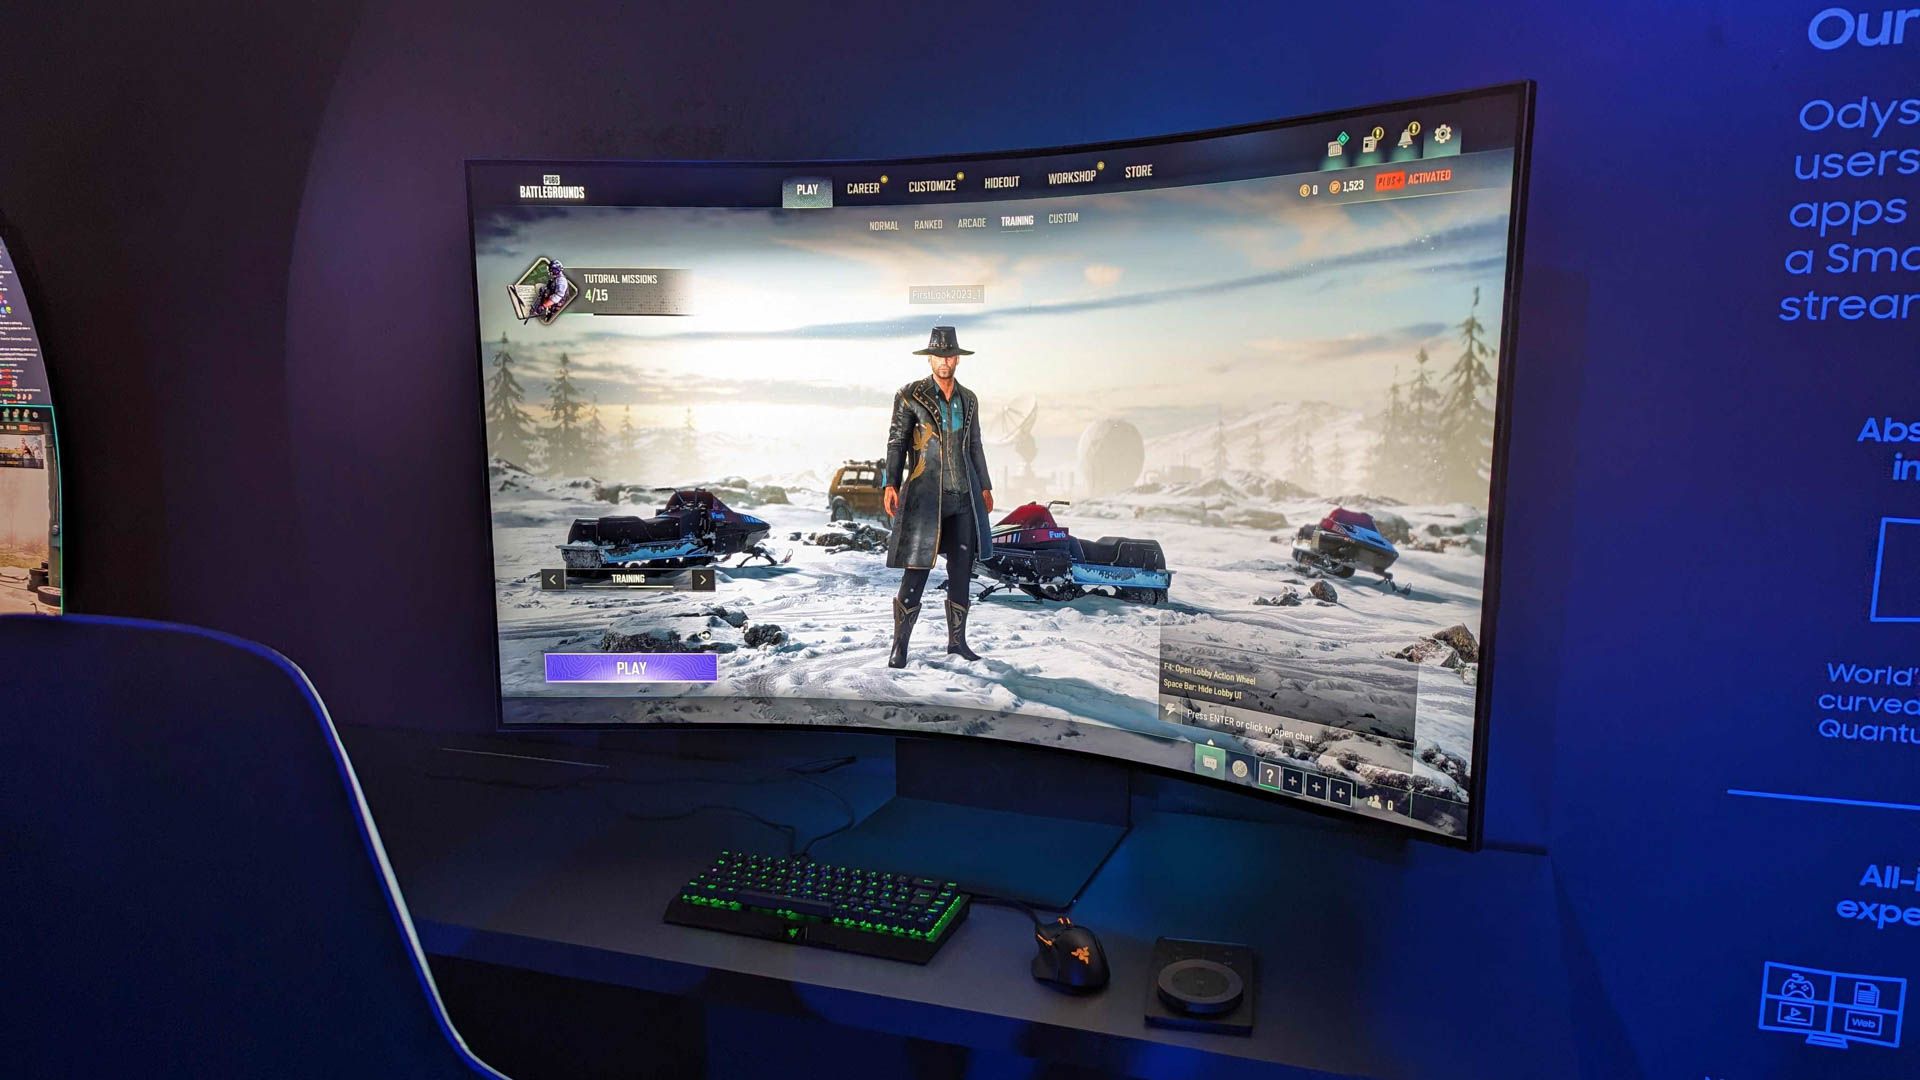
Let’s shift to in-game benchmark figures. The first is your monitor’s resolution, which has a massive impact on GPU performance and visuals, as higher resolutions make for a sharper image. That’s why any benchmark worth its salt will test performance in 1080p, 1440p, and 4K across all games.
While you should primarily focus on benchmark results for the resolution you intend to play at, don’t ignore higher resolutions. Similar to how CPU benchmarks prioritize 1080p results , higher resolution benchmarks remove the CPU from the equation, making the difference between the GPUs even more obvious.
It’s worth noting that VRAM capacity , along with texture settings, affects how high of a resolution your GPU can handle. So, two comparable GPUs that are within a few FPS at 1080p can have much wider performance gaps at 1440p and 4K.

Josh Hendrickson / How-To Geek
Average FPS, 1% Low, and Frame Time
The average FPS (Frames Per Second) is the most important number for gamers because it indicates how well a GPU performs in games. A higher average FPS means the game runs more smoothly, so it’s an extremely straightforward metric. Note that the average FPS is taken at the end of a benchmark; don’t confuse it with the current FPS, which only tells you how many frames are being pushed in any given second.
Game optimization significantly affects the average FPS, meaning the difference between different GPU brands and generations will differ depending on what type of hardware a game favors. When two GPUs from different brands are very close in price and performance overall, look closely at the benchmarks of your favorite games to make your final decision.
The figures for 1% and 0.1% lows are the lowest FPS that occur 1% and 0.1% of the time, respectively. Very low 1% lows are a sign of stutter. If 1% lows are significantly lower than the average FPS, noticeable micro-stuttering is happening with that particular piece of hardware.
CPU, RAM, software optimization, drivers, and some other factors can have a huge influence on 1% and 0.1% lows, so they’re not the be-all and end-all of GPU-induced stutter. However, if these numbers are consistently lower on one GPU compared to another model, you should dig deeper to see what the problem is if the hardware tester didn’t leave any notes.
Benchmark videos sometimes show the current frame time, which is how many milliseconds each frame takes to render. A lower number is better, but it’s worth noting that an unusually high frame time is often an indicator of driver or software issues rather than poor GPU performance.
Clock Speed
Clock speed in benchmarks only matters in the sense of how well the GPU can sustain its maximum boost clock. I only pay attention to clock speed when comparing different graphics card brands of the same GPU. For instance, if a GPU is an overclocked model that promises a clock speed uplift of 20MHz compared to stock, you’ll only see a performance improvement if the GPU can sustain that higher clock speed in games.
Ray Tracing
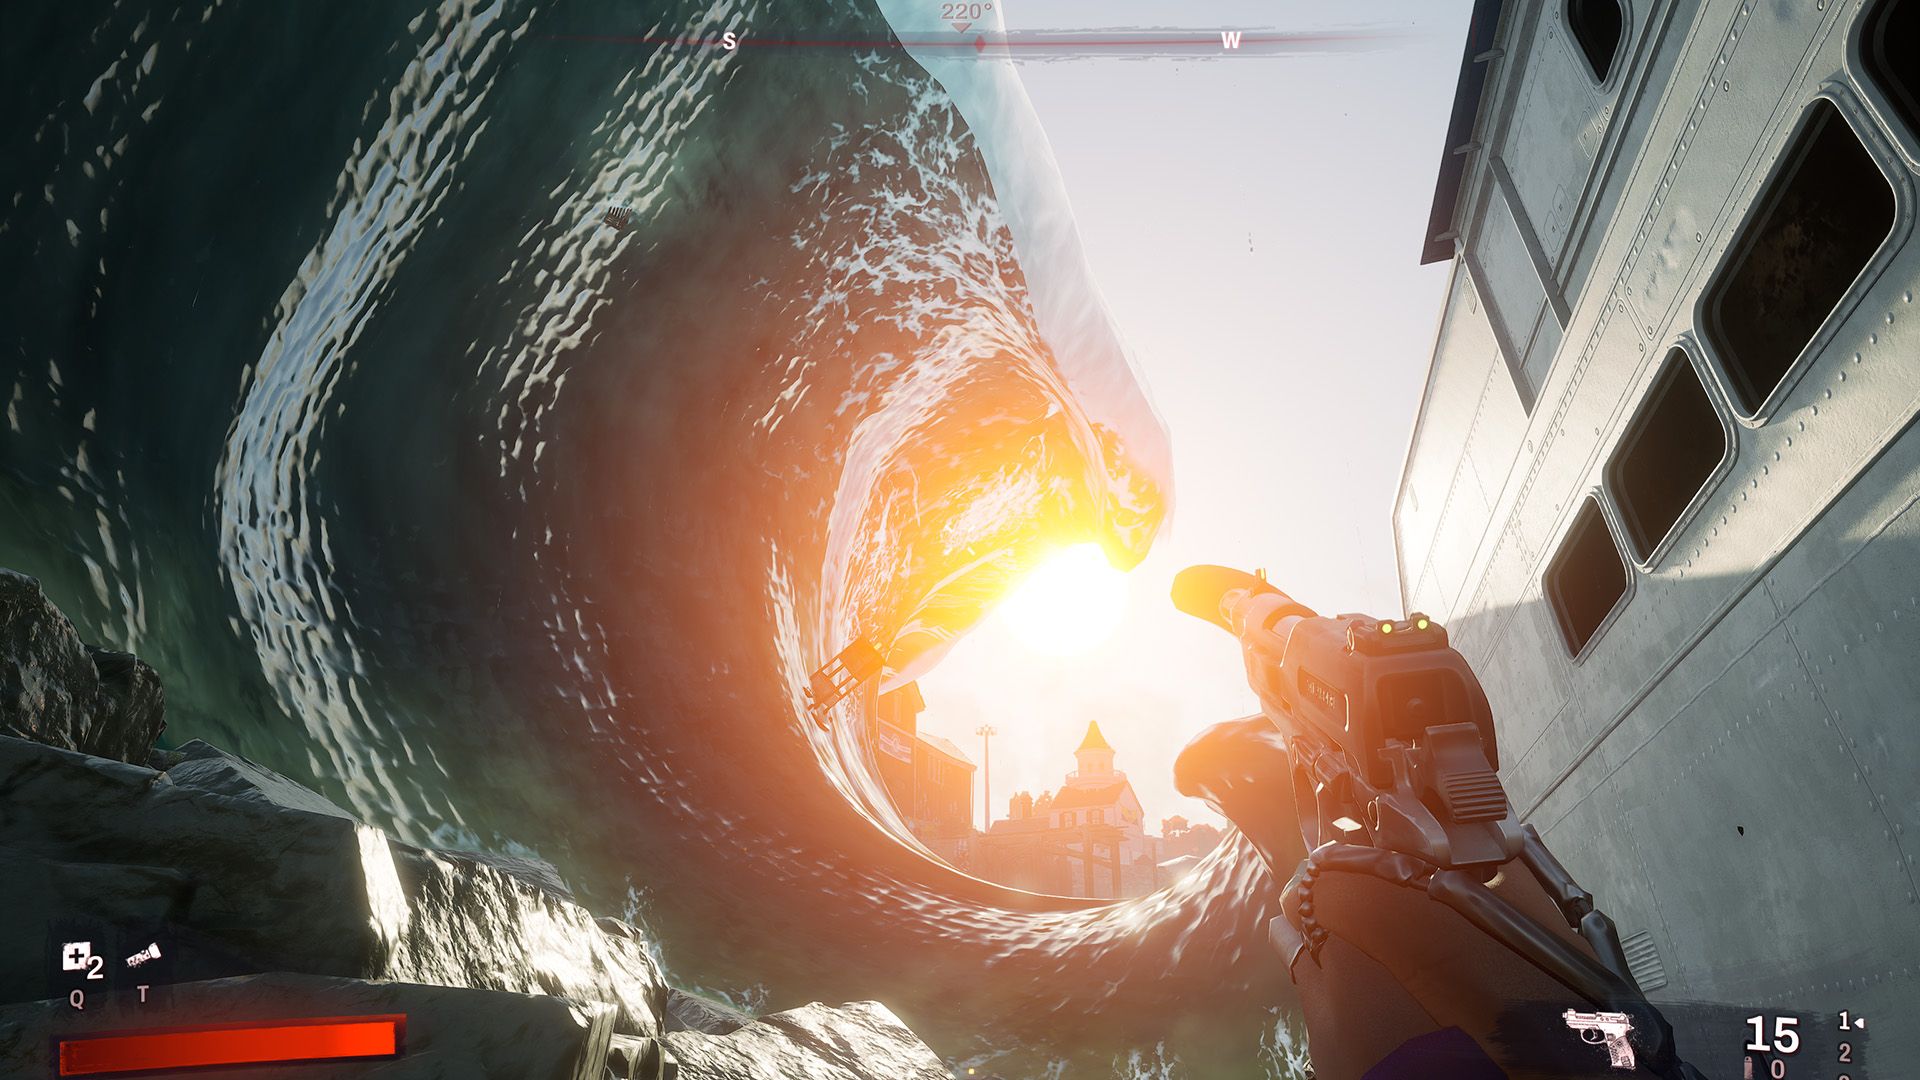
Do you like eye candy? If yes, you should care about ray tracing performance. Ray tracing still has a massive impact on FPS, but it’s getting better thanks to AI upscaling technology. So, if it’s finally time to enable at least some ray tracing options to get realistic reflections, lighting, and shadows, keep a close eye on benchmarks that feature ray tracing.
NVIDIA GPUs tend to be more expensive than comparable AMD and Intel models, but you’ll see that the price is justified after checking ray tracing benchmarks. NVIDIA cares so much about ray tracing that they switched to the RTX moniker a couple of years ago. Still, you can enable ray tracing on AMD GPUs and get decent FPS.

Cianna Garrison / How-To Geek
“Redfall”
Upscaling
DLSS, XeSS, and FSR are the latest upscaling technologies that NVIDIA, Intel, and AMD are pushing, respectively. In theory, upscaling increases your FPS significantly with a negligible impact on visuals. Then there’s the more recent introduction of frame generation . It effectively doubles your FPS by including an AI-generated frame between two real frames.
However, it’s not just a numbers game; visuals can take a hit when you enable frame generation. I’ve tried FSR frame generation in Starfield, and something about the image felt off and almost gave me motion sickness, so I disabled it. The quality of the implementation can vary significantly between games and technology vendors.
Many benchmarks today also include upscaling benchmarks, which can give you a rough idea of the performance uplift with upscaling on vs. off for any GPU. Upscaling benchmarks are especially relevant if you plan on upscaling the resolution at 1440p and 4K. For instance, the RTX 4060 significantly outperforms equivalent AMD GPUs when DLSS 3 is factored in.
Temperature, Acoustics, and Power Draw
These three metrics are interconnected and vary based on a few different factors. Newer GPUs typically have a lower power draw and consequently run cooler and quieter compared to their predecessors. For instance, the RTX 4060 Ti and RTX 3070 have reasonably similar performance in benchmarks , but the newer RTX 4060 Ti has almost half the power draw, runs a few degrees cooler, and its fans spin at lower RPMs for less noise.
Similar to clock speed, these metrics are especially relevant when comparing different versions of the same GPU. Some GPUs feature seriously overkill cooling solutions, so if the price is about the same, it makes sense to get the model that runs (and probably looks) cooler and quieter.
Regardless of what your GPU budget is, there are always a few different models to consider. That’s where benchmarks can help you make the final call. Instead of wasting hours comparing specs and teraflops , now that you know how to read them, simple benchmark comparisons might be all you need to make an informed decision.
Also read:
- [New] Expanding Creative Horizons with Custom Fonts in After Effects for 2024
- [New] In 2024, Enhancing Gaming Experience Tools Beyond Microsoft's Recorder
- [New] In 2024, The Drone Enthusiast's Guide to Vibration Reduction and Image Quality
- [Updated] ChuckleBox - Top Meme Generator for 2024
- A Week with an Ergo-Split Keyboard: How This Single Change Upgraded My Tech Habits - Insights From ZDNet
- Discover the Amazing Deal on Asus VivoBook Pro - Save $300 Now on Amazon! Exclusive Sale Covered
- Discovering Instant Transit: Mastering the Teleport Feature in Minecraft Gaming
- Exclusive List: Cyber Monday Bargains , Ranked!
- Limited Offer! Score an Essential 15-Inch Asus Laptop with All Necessary Ports on Sale at Walmart for Just $250 Insider Info
- PowerUp SEO: Elevate Your Brand Presence Through Smart Bidding Techniques
- The New Era of AI Artistry with DALL-E 3'S Editable Tools - Still Evolving
- Top-Rated Affordable Collegiate Laptop: A Great Alternative to MacBook and Lenovo ThinkPad, Now with $200 Discount - Insider Review
- Tune Into Microsoft's Surface & Windows AI Showcase: Key Insights & Anticipated Reveals for Today | TechSpotted
- Win10: Handle Overly Expansive Displays
- Title: Decoding GPU Performance Metrics: A Comprehensive Guide
- Author: George
- Created at : 2024-12-25 20:06:51
- Updated at : 2024-12-27 21:26:37
- Link: https://hardware-tips.techidaily.com/decoding-gpu-performance-metrics-a-comprehensive-guide/
- License: This work is licensed under CC BY-NC-SA 4.0.